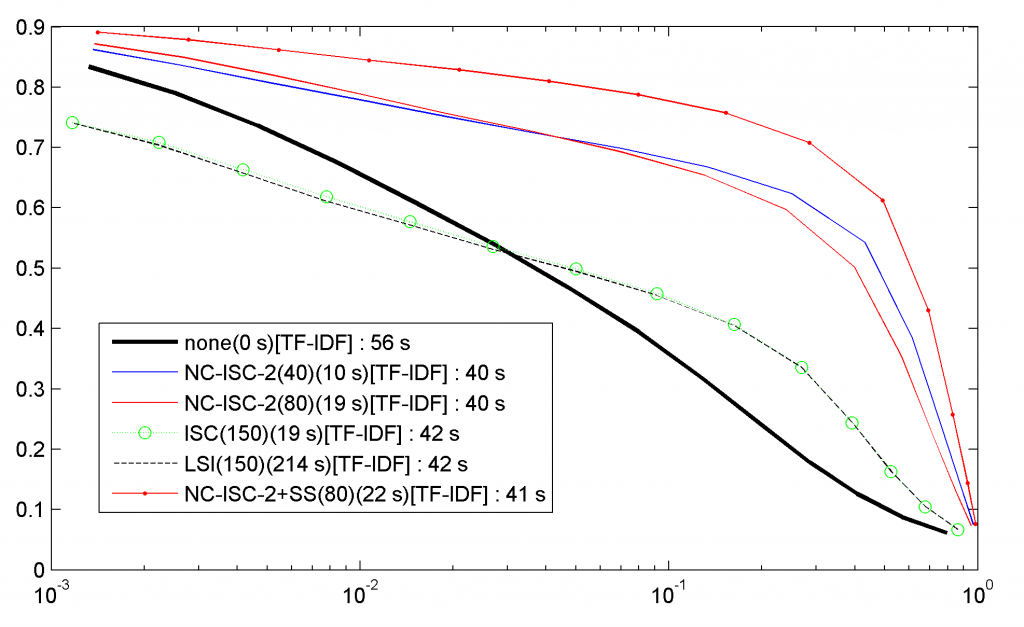
As I wrote in my last post, my methods improves things a lot on the datasets I’ve tried. The most impressive in on 20 newsgroups, mainly because I can use the full, unaltered original data easily (and thus that’s what I do).
I’ve used a classical random 80/20 split. The results are very consistent between various splits, but the results published in the Precision/Recall graph here are from a single split (I’m too lazy to change my code to average the results over several splits).
The format of the legend is as follows : Method name (Number of final features when relevant)(Time for dimension reduction) [ Regularization ]: Precision/Recall curve evaluation time
The methods :
- none means doing nothing, and just using the raw regularized data (distance for the 1-NN is cosine)
- LSI means that I used MATLAB’s svds to compute U and V (computing just U is not faster)
- ISC is my fast LSI method (Precision/Recall are the same for both methods).
- NC-ISC-2 is my little secret method
- NC-ISC-2+SS is the same but with semi-supervised class information added
The initial learning matrix is 12590 documents * 57900 words, with 1.6 Million values. My computer is a Q6600 (quad core) running at 2.4Ghz, with 8GB memory. BTW, it seems that I was wrong about the time taken to perform the TFIDF, it takes less than a second, not three seconds. Apart from the precision/recall improvement, I’m really focusing on the speed, and as I wrote in my first post, my work on the GPGPU is really producing results on improving my method speed. Doing better than MATLAB is not difficult, but the performance I reach is this : a 500000×500000 sparse matrix containing approximately 20 million values is reduced in 30 sec with a GTX 280.
