For those who followed the previous steps, I was mentionning in my previous post that there was a very odd behaviour with Count-Min-Log with MAX sampling when the number of layers in the sketch was high.
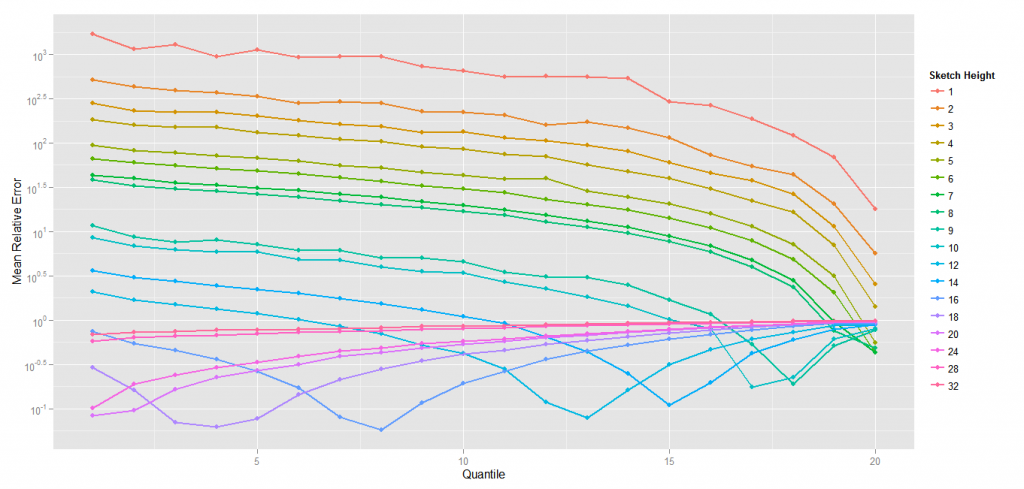
This is even more obvious when looking at relative errors by quantile with a fixed width (I draw it with a width of 64 bits in 8 8-bits counters) because it’s where the effect is the most visible) :
Relative Error curves shows a down bump starting to be visible on the 18th quantile, with a sketch height of 9 and then move to quantiles for lower frequency.
For now I only suspect this phenomenon appears with MAX sampling, but I need to rerun the tests without MAX sampling to be sure. From there, two solutions : either the MAX sampling is completely bogus, or the idea of sampling with another value is good, but it needs to be modified to correctly estimate the overrepresentation due to the position of an element in the distribution.
On a side note, it’s clear to me that it shouldn’t be too difficult to adapt MAX sampling to classical linear counting. So I’m probably going to give it a try in the next couple of weeks.
And I’m still looking for help to compute the bounds of the precision and the probability. I don’t have a clue where to start. Also, I could use some help to find the right way to compute the overestimation factor from the distribution of the sketch values for a given element.

Comments are closed, but trackbacks and pingbacks are open.