I’ve had a particularly exciting and busy week, but I did manage to find some time to pursue the empirical evaluation of the idea of using log approximate counting to improve performance of the Count-Min Sketch on the Relative Error, particulary on the low frequency items.
Last week after writing my previous post I wrote an email to Ted Dunning, asking him for some advice and feedback about my idea. He very kindly replied, and advised me to perform some verification on the behaviour of my algorithm along the axis of the width and height of the sketch.
He also politely suggested that my graph were really crappy, thanks to my inappropriate use of MS Excel to produce them. I apologize to everyone I may have hurt by doing such an awful thing, but I was in a hury and so excited that I had to do with what was available to me at the time. This week I learned enough R and ggplot to present you some fantastically interesting data in an eye-pleasing.
A few words about the setting : this time I’ve used a super tiny Zipf(1.1) synthetic corpus : vocabulary = 1024 , words = 1048576 .
Indeed, I’ve switched from a handmade Zipf sampler to the Apache Commons ZipfDistribution to eliminate a part of the possible glitches in the data, and this distribution is much slower than my implementation (but it’s probably way more accurate)
I’ve tested extensively with sketch widths ranging from 2 to 65536, and heights from 1 to 32.

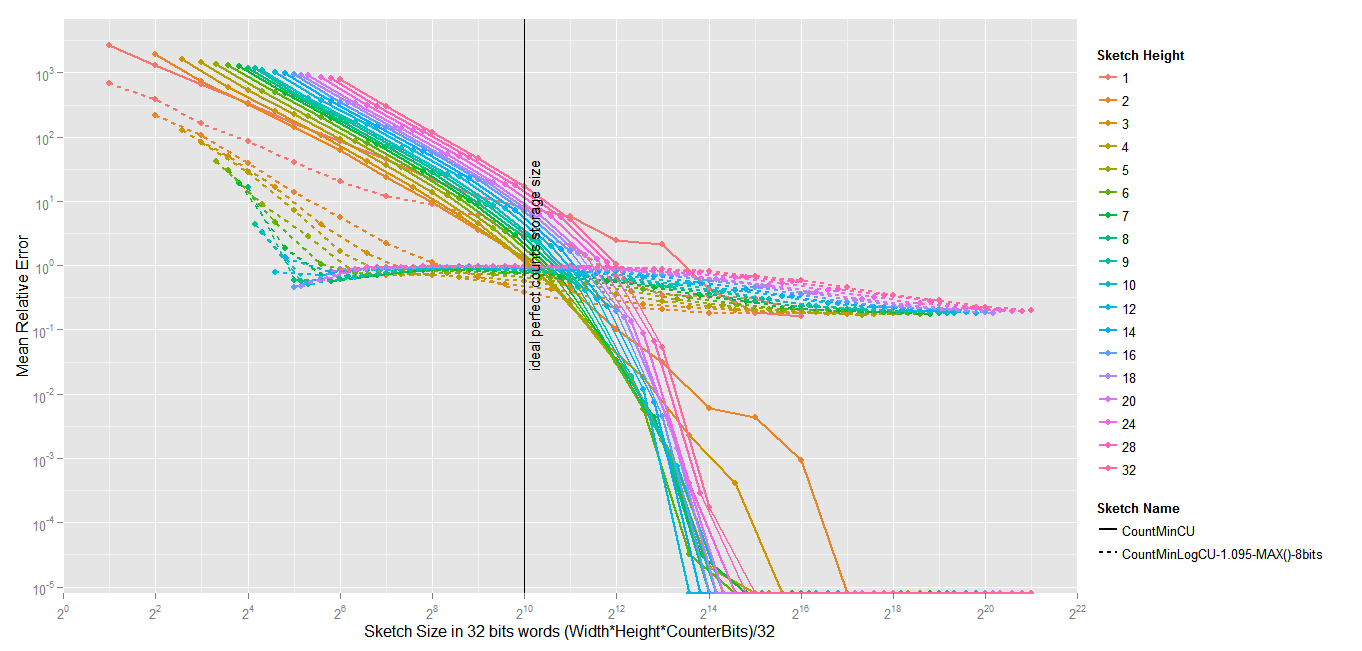
Mean Relative Error of Count-Min vs. Count-Min-Log
The first obvious observation is that Count-Min-Log is only interesting under high pressure (i.e.) the total size of the sketch is much smaller that the ideal perfect counts storage size that one would need to count the frequency of the 1024 terms occuring in the corpus (supposing you have a mapping between terms and an index).
The maximum gain is apparently obtained when the size of the sketch is 32 times smaller than the vocabulary size, and the height is clearly a very important factor in Count-Min-Log. As a consequence, if it is right to project these results to bigger settings (I don’t know if it’s right), you would get a Mean Relative Error about 350 times smaller using a Count-Min-Log Sketch of 125MB to count 1 billion elements (for instance trigrams), than using a Count-Min of the same size. To obtain the same result with a Count-Min, you would have to use a 4GB sketch.
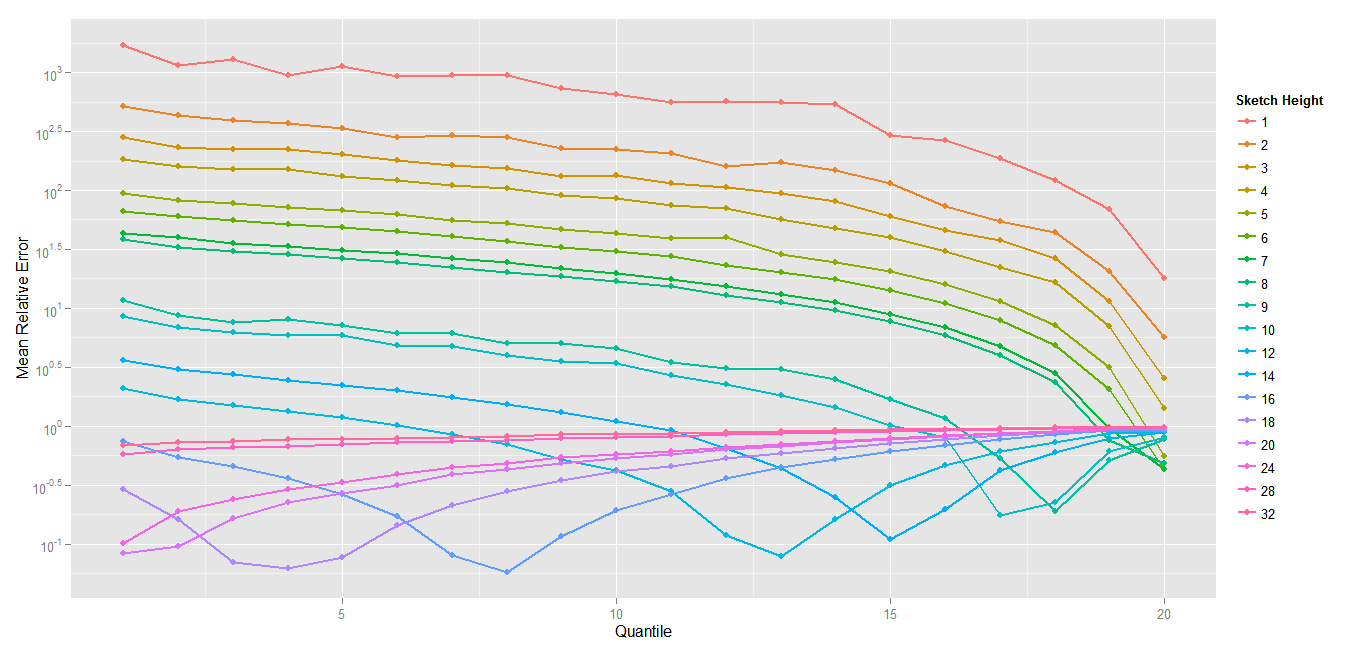
Mean Relative Error : quantile with lowest frequency items
Focusing on the first quantile (the vocabulary with the least occurrences) show a very interesting picture of the behaviour of the Count-Min-Log. The effect of the MAX sampling that underestimates the increases in the count to compensate for the collisions seems to be maximum with a given width/height ratio, which seems to be very low.
MAX sampling plays an important role in the gain seen using Count-Min-Log. Without it, the gain would be probably about 5 or 10 in the best situations. The idea of MAX sampling comes from the fact that the impact of hash collision is much more important for low frequency items than for high frequency items, by using the value of the cell with the maximum value when flipping the coin to decide whether to increment the Log counter. If an item has a low frequency, then it is very likely that the maximum value is much bigger than the min value, whereas for high frequency item, the min and the max should be very close. With MAX sampling, the increment is skipped more often, wich underestimates the count for items which would be overestimated.
So it can be understood that having more layers in the sketch is a good thing because it helps to estimate the position of the item in the distribution. However, it is maybe only true if the collisions are numerous enough.
Next post will be a test of more heights and more fine grained widths, let’s say 2,3,4…100 ?